
Johannesburg, 9 September 2026 — The GDP contraction Q2 2026 report shows South Africa’s economy shrank 0.2% in the quarter. Statistics South Africa released the figures on Tuesday, and the decline ends six consecutive quarters of growth. It is also the first quarterly fall since the third quarter of 2024. Stats SA revised first-quarter growth down to 0.4% from 0.5%. Meanwhile, annual growth slowed to 0.9% from 1.9% in the first quarter. Economists polled by Bloomberg had expected a 0.1% contraction, Moneyweb reported.
Mining, Trade And Manufacturing Drove The Q2 2026 Decline
Three industries pulled the economy lower. Mining output fell 3.0% on lower production of platinum group metals, manganese ore, gold and iron ore. Trade, catering and accommodation shrank 1.9% because wholesale trade, motor trade and food and beverages all weakened. Manufacturing declined 1.8%, with seven of its ten divisions recording negative growth. Together, these three sectors account for almost a third of GDP, Moneyweb noted. Joe de Beer, Stats SA’s head of economic statistics, said the Middle East situation had affected the numbers. The effect was clearest in manufacturing, he added. “This is manufacturing in recession, and there are multiple factors that are weighing on that,” he said.
Land Transport Grew Through The Q2 2026 GDP Contraction
Not every sector moved backwards. Transport, storage and communication grew 0.9% and added 0.1 of a percentage point to GDP. Stats SA attributed the increase to land transport. Similarly, government services and electricity both rose 1.0%. Personal services grew 0.6%, construction 0.4%, finance 0.3% and agriculture 0.3%. On the demand side, household spending rose 0.4%, but fixed investment fell 0.2%. Within that, transport equipment dropped 3.4% and construction works 4.0%. Imports surged 4.9% while exports grew only 0.9%, so net exports cut 1.1 percentage points from growth. Anchor Capital economist Lerato Ntuli told IOL the import surge largely reflected the higher fuel import bill.
Analysis
What The GDP Contraction Q2 2026 Means For Road Freight
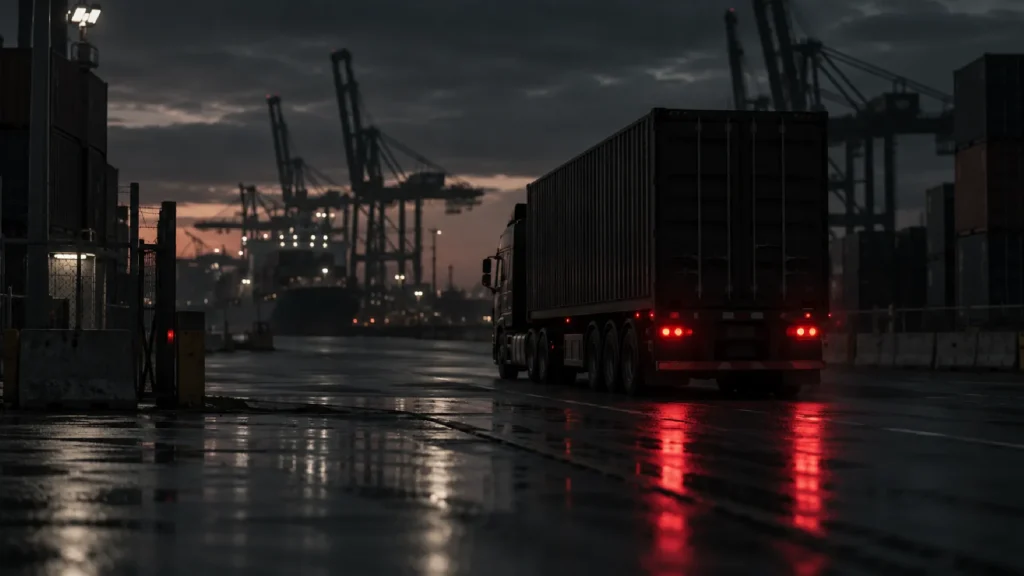
The GDP contraction Q2 2026 tells two stories at once. Factories, mines and shops produced less, yet trucks moved more. Land transport grew because freight still had to move, even as margins shrank. FNB estimates that diesel rose by a cumulative R9.39 a litre during the quarter. Petrol climbed R7.76 a litre over the same period. That cost sits inside every load that kept the transport sector in positive territory. In other words, growth in land transport measures activity, not profit.
The third quarter has started the same way. September’s fuel adjustment added R2.93 a litre to 500ppm diesel and R3.14 to 50ppm, taking 50ppm to R30.05 at wholesale. Consequently, Ntuli expects cost pressure to stay elevated through the third quarter. The contraction also complicates the interest rate outlook. BusinessDay reported on Wednesday that the weak print leaves the Reserve Bank in a bind before its 23 September meeting. Ntuli said a contraction does not veto a hike, and Anchor Capital expects a further 25 basis point increase. However, this is not yet a recession. That label requires two consecutive quarters of decline. North-West University economist Raymond Parsons describes the recovery as interrupted rather than derailed. He now projects 2026 growth of about 1.2%, below Treasury’s 1.6% target. These are projections, and the third-quarter data will test them.
For fleets, the 4.9% jump in imports is the sharpest signal. More inbound cargo is landing at Durban terminals that are already under Competition Commission scrutiny. At the same time, transport equipment investment fell 3.4%, which points to deferred truck replacement. August’s stronger heavy-truck sales suggest some operators are still buying, but October’s naamsa data will show whether that holds.
Every Sector In The Q2 2026 GDP Contraction Table
| Industry | Q2 2026 change (q/q) | Contribution |
|---|---|---|
| Mining | −3.0% | −0.1pp |
| Trade and accommodation | −1.9% | −0.2pp |
| Manufacturing | −1.8% | −0.2pp |
| Agriculture | +0.3% | 0.0pp |
| Construction | +0.4% | 0.0pp |
| Electricity, gas, water | +1.0% | 0.0pp |
| Finance and business | +0.3% | +0.1pp |
| Transport and storage | +0.9% | +0.1pp |
| Government services | +1.0% | +0.1pp |
| Personal services | +0.6% | +0.1pp |
| Total GDP | −0.2% | −0.2pp |
The Numbers Behind The Q2 2026 GDP Contraction
Fleet Impact
The Fleet Playbook For A GDP Contraction In 2026
A shrinking economy rarely reduces the work a fleet must do; it reduces what the fleet earns for doing it. Volumes held up in the second quarter, so the pressure now sits in cost per kilometre and cash collection. Operators who can see every trip, litre and idle hour will price contracts more accurately than those who cannot. Live vehicle tracking for fleet management turns route data into utilisation numbers that support rate negotiations. In addition, wholesale 50ppm diesel above R30 a litre makes truck fuel monitoring the first defence against margin erosion. Because transport equipment investment fell 3.4%, many fleets will also run older vehicles for longer. That raises the value of maintenance alerts and driver-behaviour data.
- Benchmark cost per kilometre monthly against the R9.39 a litre Q2 diesel rise. Then renegotiate fuel clauses still priced on first-quarter rates.
- Model the 23 September rate decision into finance costs now. A 25 basis point rise lifts the instalment on every floating-rate vehicle.
- Treat the 3.4% fall in transport equipment investment as an ageing-fleet signal, and extend service intervals only on telematics evidence.
- Imports rose 4.9%, so port-facing routes will stay congested. Plan Durban turnarounds around booking slots and protect standing time from cargo theft.
Fleet Technology
Fleet Technology For The 2026 GDP Contraction
DigitFMS builds the visibility a contracting economy demands. Digit D-Fuel tracks every fill, drain and burn against tank capacity and route data. In practice, it can cut fuel theft by up to 95%. Real-time tracking, driver identification and dashcams show which vehicles earn their keep and which ones drain it. Competing providers such as Cartrack, Tracker, Netstar, Ctrack and MiX by Powerfleet also offer fleet telematics. However, DigitFMS backs its systems with more than 100 franchise branches nationwide. In addition, its reporting follows South African operating cost structures. When volumes grow and margins shrink, the fleet that measures wins.
Key Numbers · GDP Contraction Q2 2026
GDP −0.2% quarter on quarter (Q1 revised to +0.4%); +0.9% year on year (Q1: +1.9%); Bloomberg consensus −0.1%
Transport, storage and communication +0.9% (+0.1pp), driven by land transport
Mining −3.0%, trade −1.9%, manufacturing −1.8% (seven of ten divisions down)
Imports +4.9%, exports +0.9%, net exports −1.1pp; fixed investment −0.2% (transport equipment −3.4%, construction works −4.0%)
Q2 cumulative fuel increases: petrol R7.76/l, diesel R9.39/l (FNB); 2 September: diesel +R2.93/+R3.14, 50ppm R30.05 wholesale
Next: Stats SA mining and manufacturing production, 10 September 2026; Reserve Bank rate decision, 23 September 2026
Source: Statistics South Africa, GDP Q2 2026 (P0441), released 8 September 2026; FNB, Anchor Capital, Moneyweb and BusinessDay, 8–9 September 2026.
Questions Answered
Frequently Asked Questions: GDP Contraction Q2 2026
What Caused The GDP Contraction In Q2 2026?
Mining fell 3.0%, trade 1.9% and manufacturing 1.8%, and together they subtracted 0.5 of a percentage point from growth. Stats SA linked the weakness to the Middle East conflict, and economists point to the fuel price surge that followed. On the spending side, imports rose 4.9% and fixed investment fell 0.2%.
Why Did Land Transport Grow During The Q2 2026 Contraction?
Freight kept moving even as output fell, and higher import volumes added to port and corridor traffic. GDP measures activity in constant prices, so land transport can grow while operator margins shrink under diesel costs. The sector rose 0.9% and contributed 0.1 of a percentage point.
How Much Did Diesel Rise During Q2 2026?
FNB puts the cumulative second-quarter increase at R9.39 a litre for diesel and R7.76 a litre for petrol. September then added R2.93 a litre to 500ppm diesel and R3.14 to 50ppm. Wholesale 50ppm diesel now costs R30.05 a litre.
Is South Africa In A Recession After The Q2 2026 GDP Fall?
Not yet. Most economists define a recession as two consecutive quarters of decline, and only one has occurred. Stats SA’s third-quarter release, normally published in early December, will decide. Until then, economist Raymond Parsons describes the recovery as interrupted rather than derailed.
What Does The GDP Contraction Mean For Interest Rates?
The Reserve Bank meets on 23 September 2026. Anchor Capital’s Lerato Ntuli says a contraction does not veto a hike. Her firm expects a further 25 basis point increase. July inflation eased to 4.3%, but she expects it to stay above 4% into early 2027.
Will Truck Sales Recover After The Q2 2026 GDP Contraction?
Transport equipment investment fell 3.4% in the quarter, which signals deferred replacement. However, naamsa’s August figures showed heavy commercial vehicle sales up 10.1% and medium trucks up 16.3% on a year earlier. October’s release will show whether renewal survives R30 diesel.
What Should Fleet Operators Do After The GDP Contraction Q2 2026?
Measure cost per kilometre monthly, renegotiate fuel clauses, and base maintenance decisions on telematics rather than age alone. Plan port-facing routes around booking slots, because import volumes are rising. Above all, protect cash, since a contracting economy stretches payment terms first.
Facts checked 9 September 2026. Source: Statistics South Africa, Moneyweb, IOL and BusinessDay. Related: August truck sales and the Q2 Ctrack freight index.
© 2026 DigitFMS. All rights reserved.