
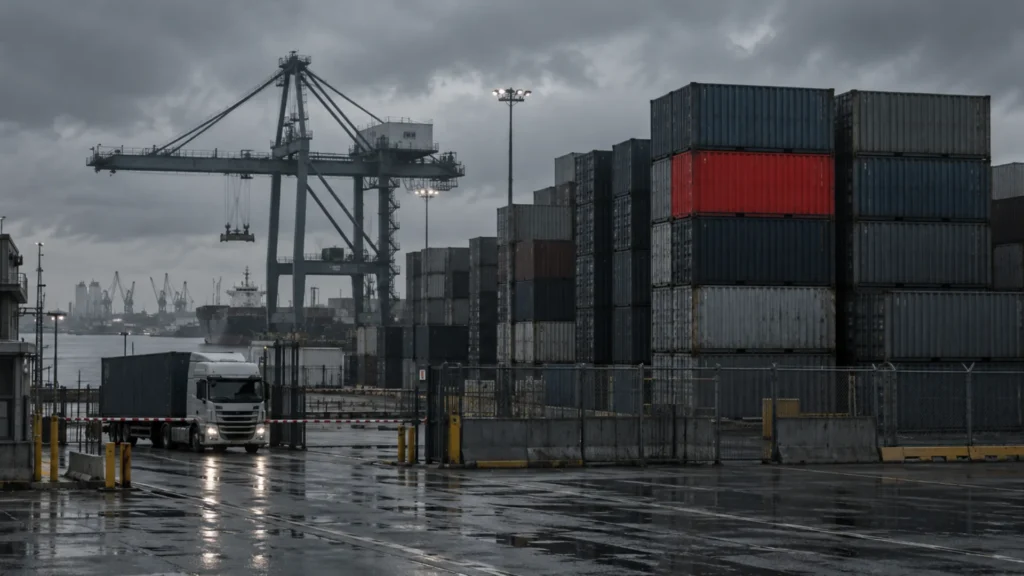
Johannesburg, 18 September 2026 — The container volumes August 2026 figures show South Africa’s ports handled 382,755 TEUs last month. That is 7% down on July’s 411,056 TEUs and also 7% down on August 2025. The Southern African Association of Freight Forwarders (SAAFF) compiled the data, and Freight News reported it on Thursday. Landed containers fell 6% to 201,008 TEUs, while shipped containers fell 7% to 181,747 TEUs.
Even so, the year-to-date picture is still positive. Container throughput for 2026 so far runs 4.9% ahead of the same period in 2025. However, August alone sat 14% below August 2019, the last pre-pandemic comparison. SAAFF attributed the monthly decline to “recent operational difficulties at the Durban Gateway Terminal”. In addition, the association described the wider port recovery as “uneven and fragile”.
Meanwhile, other cargo classes moved in different directions. Dry bulk rose 2% year on year to 14.73 million tonnes, and breakbulk climbed 10% to 630,744 tonnes. Vehicles were the strongest category, up 19% to 96,945 units, while liquid bulk was the weakest. Specifically, liquid bulk fell 10% to 2.58 million tonnes. Year-to-date bulk cargo volumes were 7.6% higher than the corresponding 2025 period.
Why The Container Volumes August 2026 Data Matters Now
This is also the first national dataset to carry the Durban Gateway Terminal (DGT) disruption. Congestion at the terminal escalated in mid-August after a systems transition. Then, last week, DGT conceded that its slot-booking system is failing. Its own daily throughput ran 30.5% below the preceding four months between 14 August and 10 September. Consequently, a terminal that handles more than 40% of the country’s container traffic has pulled the national number negative for the month.
A Month After Transnet’s Record Line
The timing is awkward for the port system’s owner, too. Transnet’s annual results on 10 September reported 4.58 million TEUs for the year to March, up 7%. Since then, however, the August data has recorded a 7% fall in a single month. The two figures are not contradictory, because the financial year closed before the DGT transition. Nevertheless, they show how quickly one terminal can reverse a national trend. Moreover, the anchorage queue at Durban only began shortening in the second week of September. So the September figure will also carry some of the damage.
Analysis
What The Container Volumes August 2026 Fall Means For Road Freight
Containers move by truck on both ends of a port call. So a national TEU decline is also a national loss of harbour-carrier work. The Desk has already priced the queue at DGT. Now the volume itself gets the same treatment. Specifically, between July and August, the system handled 28,301 fewer TEUs. At roughly 1.6 TEUs per truck movement, that is about 17,700 fewer truck loads in the month. In daily terms, close to 570 loads did not happen. Some of that cargo is still waiting at anchorage and will arrive later. Some has diverted to Ngqura, Cape Town or Maputo instead. Either way, for the Durban harbour-carrier community it was a month of trucks standing still and revenue not earned. For context, in the Competition Commission complaint, 140 hauliers said exactly this would happen.
The Desk Calculation: One Terminal Against The Country
Here is the arithmetic, with the assumptions shown. First, DGT’s shortfall alone was about 1,614 TEUs a day against its four-month average, according to the SAAFF/BUSA Cargo Movement Update. Over a 31-day month, that is roughly 50,000 TEUs. Yet the national decline was only 28,301 TEUs. In other words, the rest of the system absorbed something like 20,000 TEUs that DGT could not handle. Durban Pier 1, Ngqura and Cape Town took that work. Clearly, that is good news for operators with capacity at those ports. However, it is bad news for anyone with contracts and trucks tied to Bayhead Road.
Furthermore, the vehicle line tells a second story. Car exports rose 19% to 96,945 units, so car-carrier demand on the Gauteng–Durban and Gauteng–Gqeberha corridors is strong. Those are also the same corridors Transnet has earmarked for its dual rail channel in 2026/27.
Container Volumes August 2026 By Cargo Class
| Cargo class | August 2026 | Change |
|---|---|---|
| Containers — total | 382,755 TEU | −7% m/m; −7% y/y |
| Containers — landed | 201,008 TEU | −6% |
| Containers — shipped | 181,747 TEU | −7% |
| Containers — year to date | — | +4.9% vs 2025; Aug 14% below Aug 2019 |
| Dry bulk | 14.73Mt | +2% y/y |
| Breakbulk | 630,744t | +10% y/y |
| Vehicles | 96,945 units | +19% y/y |
| Liquid bulk | 2.58Mt | −10% y/y |
| Bulk cargo — year to date | — | +7.6% vs 2025 |
The Numbers Behind The Container Volumes August 2026 Report
Fleet Impact
The Fleet Playbook For A Shrinking Container Month
A 7% volume fall does not spread evenly across hauliers. Instead, it lands on the operators locked to one terminal, one shipping line or one import client. The fleets that come through it will be the ones that can prove utilisation. They will also move capacity to where the boxes actually are. First, that means knowing each truck’s loaded kilometres, empty kilometres and standing hours for August, not the fleet average. Second, it means pricing the diesel burned in queues separately from the diesel burned earning revenue. Live vehicle tracking for fleet management gives the first set of numbers. Truck fuel monitoring gives the second. At September’s R30 diesel, that difference is the margin.
- First, pull August utilisation per truck. If loaded kilometres fell more than 7%, the fleet lost share as well as volume. If they fell less, it gained. Either way, that number opens the next rate negotiation.
- Second, follow the boxes. Roughly 20,000 TEUs shifted away from DGT in August. Ngqura, Cape Town and Durban Pier 1 harbour carriers should therefore be quoting for that work now. After the lines reroute permanently, it is gone.
- Third, the vehicle trade is the growth lane. Car exports rose 19%. So car-carrier operators on the Gauteng–Durban and Gauteng–Gqeberha runs should lock multi-year contracts while rail’s dual channel is still a plan.
- Finally, treat the container volumes August 2026 figure as the floor, not the trend. September will carry part of the DGT backlog too. So budget on flat volumes through the third quarter, and price standing time into every port-side contract.
Fleet Technology
Fleet Technology For A Port System That Moves The Work Around
When volume shifts between ports, the haulier who knows its own numbers moves with it. The one who guesses gets left at the gate. DigitFMS tracking reports loaded and empty kilometres, gate-to-gate times and standing hours per vehicle. As a result, a fleet manager can see within a week which port precinct is earning and which is costing. Digit D-Fuel then splits the litres between revenue kilometres and queue idling. That is precisely the figure a cost-per-TEU calculation needs. Finally, driver identification and live dashcams complete the record for any dispute with a terminal or a line. Cartrack, Netstar, Tracker, Ctrack and MiX by Powerfleet operate in the same telematics market. DigitFMS’s difference is its branch network of more than 100 outlets, including Durban, Gqeberha and Cape Town. So support is at the port rather than in a call centre.
Key Numbers: Container Volumes August 2026 At A Glance
Key Numbers · Container Volumes August 2026
Containers: 382,755 TEU (July 411,056), −7% m/m, −7% y/y; landed 201,008 (−6%), shipped 181,747 (−7%); YTD +4.9% vs 2025; August 14% below August 2019
Other cargo y/y: dry bulk 14.73Mt (+2%); breakbulk 630,744t (+10%); vehicles 96,945 units (+19%); liquid bulk 2.58Mt (−10%); bulk YTD +7.6%
SAAFF: decline attributed to “recent operational difficulties at the Durban Gateway Terminal”; recovery “uneven and fragile”
Context: DGT throughput 3,672 TEU/day (14 Aug–10 Sep) vs 5,286 baseline, −30.5%; DGT handles >40% of SA container traffic; Transnet FY26 (to March): 4.58m TEU, +7%
Desk calculation: m/m drop 28,301 TEU ≈ 17,700 truck loads at 1.6 TEU/truck ≈ 570 loads/day; DGT shortfall ≈ 1,614 TEU/day ≈ 50,000 TEU/month, so ≈ 20,000 TEU absorbed elsewhere in the system
Next: SAAFF September port data (~mid-October); weekly SAAFF/BUSA CMU; DGT slot-system go-live date; Transnet interims (~December)
Source: SAAFF monthly port statistics for August 2026 as reported by Freight News, 17 September 2026; SAAFF/BUSA Cargo Movement Update to 10 September 2026; Transnet annual results, 10 September 2026.
Questions Answered
Frequently Asked Questions: Container Volumes August 2026
How Many Containers Did SA Ports Handle In August 2026?
South African ports handled 382,755 TEUs in August, according to SAAFF. That is 7% below July’s 411,056 TEUs and also 7% below August 2025. Landed boxes fell 6% to 201,008 TEUs, while shipped boxes fell 7% to 181,747 TEUs.
Why Did Container Volumes Fall In August?
SAAFF points to operational difficulties at the Durban Gateway Terminal, which handles more than 40% of the country’s container traffic. Specifically, congestion there escalated in mid-August after a systems transition. Since then, the terminal has admitted that its slot-booking system is failing.
Is The Port Recovery Over?
Not on the year-to-date numbers, which still remain 4.9% ahead of 2025. However, SAAFF calls the recovery “uneven and fragile”, and August sat 14% below the same month in 2019. Since September will also carry part of the Durban backlog, the third quarter is likely to be flat at best.
What Does A 7% Container Fall Mean In Truck Loads?
The Desk estimate, at 1.6 TEUs per truck movement, is about 17,700 fewer truck loads in August than in July. That is close to 570 a day. Because DGT’s own shortfall was larger than the national drop, roughly 20,000 TEUs appear to have shifted to other terminals instead.
Which Cargo Types Grew Despite The Container Volumes August 2026 Fall?
Vehicles led with 19% growth to 96,945 units, followed by breakbulk at 10% and dry bulk at 2%. By contrast, liquid bulk was the other decliner, down 10%. Overall, bulk cargo is 7.6% ahead of 2025 for the year to date.
How Should Harbour Carriers Respond?
First, measure August utilisation per truck rather than relying on the fleet average. Then quote for the volume that has moved to Ngqura, Cape Town and Durban Pier 1. Finally, price standing time into every port-side contract, because the September figure will still reflect the Durban backlog.
Facts checked 18 September 2026. Source: Freight News (SAAFF August port data), Freight News (DGT throughput), SAnews (Transnet results) and Moneyweb. Related: the DGT Competition Commission complaint and August truck sales.
© 2026 DigitFMS. All rights reserved.