
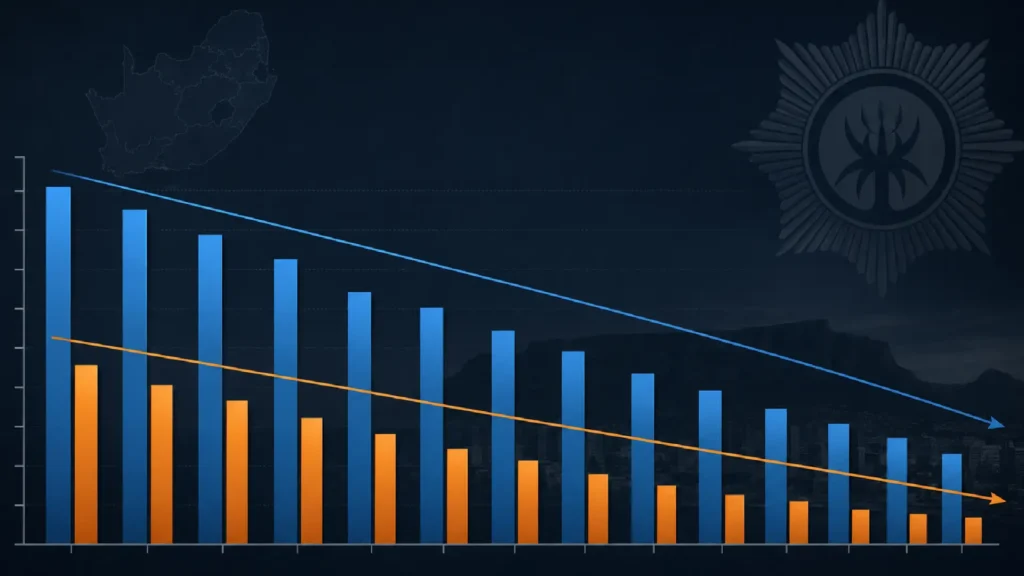
The latest SAPS crime statistics fleet security implications are clear: the trend is improving, but the risk remains extreme. Police Minister Firoz Cachalia released the Q4 2025/26 data on Friday 22 May, covering January to March 2026. Carjackings fell 8.1% to 4,420 cases — but that still means 48 vehicles hijacked every day. Truck hijackings dropped 21.62%. Murders declined 9.5% to 5,181 — still 58 per day. However, the headline improvements mask alarming details: organised crime syndicates now account for 57.1% of all carjackings. Mamelodi East recorded 82 carjackings in one quarter — the worst precinct nationally. Alexandra surged from 36 to 76. And the Road Freight Association warns the real numbers are higher because 23% of hijackings go unreported.
This analysis breaks down the official Q4 data through a fleet security lens, updates the precinct-level risk map that fleet operators use for route planning, explains why the organised syndicate data changes the security calculus, and recalculates what the numbers mean for vehicle tracking, recovery, and insurance in 2026.
The Headline Numbers: What the SAPS Crime Statistics Fleet Security Data Shows for Q4
Specifically, Cachalia presented the figures alongside Deputy Minister Cassel Mathale and Acting National Commissioner Lieutenant General Puleng Dimpane. The data covers 1 January to 31 March 2026. Here are the numbers that matter most for fleet operators.
Carjacking crime statistics: 48 per day, down 8.1%
Specifically, SAPS recorded 4,420 carjackings in Q4 — down from 4,807 in the same quarter last year. That represents a decline of 387 cases, or 8.1%. However, the quarterly total still means roughly 48 vehicles hijacked per day. Our previous reporting cited 50 per day based on Q3 data — the trend has marginally improved but the volume remains staggering. Furthermore, the StatsSA Victims of Crime Survey estimates that 23% of hijackings go unreported, meaning the real daily figure is closer to 62.
Truck hijacking fleet security data: down 21.62%
Notably, this is the most encouraging figure for fleet operators. Truck hijackings declined 21.62% year-on-year in Q4. Gauteng recorded 223 truck hijackings — approximately 64% of the national total. KwaZulu-Natal followed with 32 cases, Mpumalanga with 25, North West with 21, Eastern Cape with 19, Western Cape with 13, Limpopo with 9, Free State with 7, and Northern Cape with zero. Nevertheless, RFA chief executive Gavin Kelly cautioned against reading too much into the decline, pointing to “longstanding industry concerns over under-reporting and lack of trust in the police.”
Business robberies: down 18.3%
Similarly, robberies at non-residential premises — which include fleet depots, warehouses, and fuel storage facilities — declined 18.3%. This is significant for fleet operators whose fixed assets face direct robbery risk. Combined with the 20.4% decline in house robberies, the data suggests that contact crime targeting fixed premises is falling faster than carjacking. The difference may reflect improved physical security at premises (CCTV, access control, electric fencing) while vehicle crimes remain harder to prevent without tracking technology.
The broader violent crime picture
Overall, contact crimes dropped 4.6%, with 7,405 fewer cases recorded. Murders fell 9.5% from 5,727 to 5,181 — the fourth consecutive quarter with year-on-year declines. The murder rate stands at 8.2 per 100,000 nationally, with the Eastern Cape recording the highest ratio at 14.3. Cash-in-transit robberies dropped 12.5%. Bank robberies remained at zero for the third consecutive quarter. Cachalia acknowledged the improvement while stating that “violence and criminality remained unacceptably high.”
The Syndicate Data: Why 57.1% Changes the SAPS Crime Statistics Fleet Security Picture
Fundamentally, the most consequential data point for fleet operators is not the overall decline. It is the syndicate composition.
Crime statistics show organised syndicates dominate fleet security threats
Crucially, the Q4 data reveals that organised crime syndicates account for 57.1% of all carjackings nationally. They also drive 54.8% of kidnappings and 48.4% of cash-in-transit robberies. Swisher Post reports these syndicates “operate primarily in the country’s economic hubs, with Gauteng’s concentration of industrial and logistics activity making it a recurring focal point.” This data confirms what fleet operators and the truck hijacking analysis have documented: carjacking is not opportunistic street crime. It is a professional, syndicate-driven enterprise targeting specific vehicles, specific routes, and specific cargo.
What syndicate-driven crime means for fleet security
Consequently, when 57% of carjackings involve syndicates, the security response must match the sophistication of the threat. Opportunistic hijackings can be deterred by visible security measures — marked vehicles, visible tracking stickers, driver awareness. Syndicate operations use GPS jammers, fake police blue lights, insider informants, and surveillance of driver routines. Consequently, fleet security technology must counter these specific tactics: jam detection alerts when GPS signals disappear, tamper sensors that trigger when hardware is interfered with, driver identification that detects when an unauthorised person operates the vehicle, and autonomous vehicle defence that disables the engine remotely.
The Aon insider threat connection
The syndicate data aligns directly with Aon’s finding that insider enablement is a primary hijacking tactic. Syndicates recruit drivers, depot staff, and logistics personnel to provide route information, disable tracking, or create opportunities for interception. The 57.1% figure quantifies what fleet security professionals have known operationally: the majority of hijackings involve planning, reconnaissance, and often insider assistance. Driver identification and route management systems are the direct countermeasure.
The Precinct Map: Updated SAPS Crime Statistics Fleet Security Hotspots
Accordingly, the Q4 data updates the precinct-level risk map that fleet operators should use for route planning and geofencing.
Gauteng crime statistics: 21 of the top 30 fleet security hotspots
Monitor Net confirms that 21 of the country’s top 30 carjacking precincts sit inside Gauteng. Mamelodi East in Tshwane recorded the worst carjacking figure nationally — 82 cases in a single quarter. That is nearly one carjacking per day in a single precinct. Alexandra surged from 36 to 76 cases — more than doubling. Fleet operators with delivery routes through Mamelodi, Alexandra, Hillbrow, Johannesburg Central, or Tembisa face the highest statistical hijacking probability in the country.
Provincial truck hijacking distribution
Gauteng’s 223 truck hijackings represent 64% of the national total — consistent with previous quarters. The N1, N3, N12, and N17 corridors remain the primary interception routes. KwaZulu-Natal’s 32 cases concentrate on the N3 Durban-to-Johannesburg freight corridor and the N2 south coast route. Mpumalanga’s 25 cases reflect the province’s role as a transit corridor between Gauteng and Mozambique — a route that the Madlanga Commission testimony confirmed drug cartels also exploit.
The underreporting gap
Moreover, the Victims of Crime Survey estimates 23% of hijackings go unreported. RFA’s Kelly attributes this to “lack of trust in the police” — a concern that the 18 suspended SAPS officers and the Madlanga Commission revelations have only deepened. For fleet operators, this means the official data represents a minimum baseline. The actual risk is 20% to 25% higher than the published figures suggest. A precinct recording 82 carjackings may actually experience over 100.
What the Q4 Data Means for Vehicle Recovery and Insurance
Importantly, the decline in carjackings does not change the recovery equation. The tracked-versus-untracked gap remains the most important statistic for fleet operators.
Fleet security recovery rates hold steady despite crime statistics shift
Reassuringly, tracked vehicles maintain an 82% to 88% recovery rate. Cartrack reports 88.3% nationally. Tracker reports recovery rates exceeding 90% for monitored vehicles. Untracked vehicles remain at approximately 35%. Recovery time averages 9.4 hours for tracked vehicles versus 21.7 hours for untracked. These figures have not changed materially despite the overall decline in hijacking numbers — confirming that tracking technology, not police statistics, determines individual fleet recovery outcomes.
Insurance implications of the syndicate data
Equally, the 57.1% syndicate figure may influence how insurers assess fleet risk. Syndicate-driven hijackings are more likely to involve GPS jamming, which defeats basic tracking. Insurers like Santam already mandate dual tracking devices for high-risk vehicles. The Q4 data provides statistical justification for insurers to tighten these requirements further. Fleet operators who already exceed the minimum tracking standard — with jam detection, tamper alerts, and autonomous defence — will absorb any mandate changes without disruption.
The Kruger Park case underlines the data
Strikingly, on the same day Cachalia released the Q4 statistics, a retired Mossel Bay couple were found murdered inside the Kruger National Park — their vehicle hijacked and driven across the Mozambique border. The bakkie remains missing. If it had GPS tracking with cross-border connectivity, the position would be known. The Kruger case — the first murder inside the park in 100 years — illustrates that hijacking risk extends beyond urban hotspots. No location is immune. The technology inside the vehicle determines whether the vehicle is recovered or lost permanently.
Five Actions Fleet Operators Should Take Based on the Q4 SAPS Crime Statistics Fleet Security Data
Update your geofencing to reflect the new precinct rankings. Mamelodi East (82 cases) and Alexandra (76 cases) are now the two highest-risk carjacking precincts nationally. If your fleet routes pass through these areas, tighten geofence alerts and ensure drivers receive real-time notifications when approaching or entering these precincts. Review the full top-30 list and adjust routing where alternatives exist.
Next, upgrade from basic tracking to anti-syndicate technology. With 57.1% of carjackings involving syndicates that use GPS jammers, basic GPS tracking is insufficient. Ensure every vehicle has jam detection that alerts when GPS signals disappear, tamper sensors that trigger when hardware is interfered with, and autonomous vehicle defence that enables remote engine disabling. The syndicate data justifies this investment quantitatively.
Additionally, strengthen insider threat controls. The syndicate composition data confirms that most hijackings involve planning and often insider assistance. Driver identification using iButton or Bluetooth beacons verifies who operates each vehicle on every trip. Route management with geofencing detects deviations from approved routes. Together these systems catch the moment an insider creates an opportunity for syndicate interception.
Evidence, insurance, and vigilance
Ensure AI dashcams capture and upload continuously. With the SAPS leadership crisis continuing — 18 officers suspended, the Madlanga Commission ongoing — self-generated evidence becomes more valuable for insurance claims, criminal prosecution, and disciplinary processes. Cloud upload preserves footage even if the vehicle or camera is damaged during the hijacking.
Furthermore, do not reduce security investment because statistics improved. The 8.1% carjacking decline and 21.62% truck hijacking decline are encouraging. However, 48 daily hijackings and 23% underreporting mean the absolute risk remains extreme. The decline may partly reflect improved tracking adoption — meaning the technology is working. Reducing investment because the numbers improved would be removing the tool that produced the improvement. Cachalia himself stated that violence remains “unacceptably high.”
Who Provides the Anti-Syndicate Fleet Security Technology the Q4 Data Demands
Clearly, the 57.1% syndicate figure demands fleet security technology designed to counter professional criminal operations — not just opportunistic theft.
DigitFMS provides jam detection, tamper alerts, autonomous vehicle defence, AI dashcams with cloud upload, wireless driver identification, D-Fuel monitoring, and GPS tracking with geofencing on a single integrated platform. When a syndicate deploys a GPS jammer, the jam detection system alerts the control room immediately — triggering armed response before the vehicle goes silent. The company’s 100+ franchise branches provide local recovery coordination in all nine provinces, including the Gauteng precincts where 64% of truck hijackings occur.
Tracker’s recovery network delivered 3,671 recoveries with 146 arrests in H1 2025 alone. Cartrack’s 88.3% recovery rate and dual-tracker capability counter the syndicate tactic of disabling a single unit. Netstar’s insurance integration streamlines claim processing after an incident. Ctrack and MiX by Powerfleet serve enterprise fleets with customised security solutions for mining, construction, and logistics sectors. The common requirement: anti-syndicate capability — jam detection, tamper alerts, autonomous defence — not just basic GPS.
Outlook: The Q4 SAPS Crime Statistics Fleet Security Trend Is Cautiously Positive
Looking ahead, the direction of travel is genuinely positive. Four consecutive quarters of declining murder. Carjackings down 8.1%. Truck hijackings down 21.62%. Business robberies down 18.3%. These are real improvements that reflect both enhanced enforcement and improved technology adoption across the fleet sector.
However, the Q4 data contains a critical warning embedded in the syndicate figures. The decline in total numbers may mask a consolidation — fewer hijackings but more of them professionally planned, syndicate-driven, and harder to prevent with basic security. A market where 57.1% of carjackings involve organised syndicates is a market where the remaining opportunistic crimes decrease while the sophisticated operations continue. Fleet operators who celebrate the declining headline and reduce investment will be the first to discover that the syndicates did not decline — they become more organised.
Ultimately, the SAPS crime statistics fleet security lesson from Q4 is nuanced. The numbers are better. The risk is still extreme. The nature of the threat has shifted from volume to sophistication. The 82% recovery rate for tracked vehicles holds regardless of overall crime trends — because tracking technology catches syndicate operations just as effectively as opportunistic ones. The operators who maintain and upgrade their security posture during the decline will be protected when the next uptick arrives. The operators who ease off will learn that 48 hijackings per day — with 57% involving professional syndicates — is not a number that justifies a false sense of safety.
Frequently Asked Questions
What do the latest SAPS stats show for carjackings?
Q4 2025/26 recorded 4,420 carjackings — down 8.1% from 4,807. That is still 48 vehicles hijacked per day. The Victims of Crime Survey shows 23% go unreported, meaning the real figure is closer to 62 per day. Gauteng accounts for more than half of all carjackings nationally.
How much did truck hijackings decline?
Truck hijackings dropped 21.62% year-on-year. Gauteng recorded 223 cases (64% nationally), KZN 32, Mpumalanga 25, North West 21, Eastern Cape 19, Western Cape 13. The RFA warns figures likely undercount reality due to underreporting and distrust of police.
Which precincts are worst for carjackings?
Mamelodi East in Tshwane leads nationally with 82 cases in one quarter. Alexandra surged from 36 to 76. Twenty-one of the top 30 carjacking precincts sit inside Gauteng. Fleet operators with routes through these precincts face the highest statistical hijacking probability in South Africa.
What role do syndicates play in carjackings?
Organised crime syndicates account for 57.1% of all carjackings, 54.8% of kidnappings, and 48.4% of CIT robberies. They use GPS jammers, fake blue lights, insider informants, and route surveillance. This confirms hijacking is a professional, syndicate-driven enterprise — not opportunistic street crime.
Did overall violent crime decline?
Contact crimes dropped 4.6% (7,405 fewer cases). Murders fell 9.5% to 5,181 (still 58/day). House robberies down 20.4%. Business robberies down 18.3%. CIT robberies down 12.5%. Bank robberies remained at zero for the third consecutive quarter. This represents four consecutive quarters of declining murder.
Are the SAPS statistics reliable?
The RFA’s Gavin Kelly expressed scepticism, citing underreporting and distrust of police. The Victims of Crime Survey estimates 23% of hijackings go unreported. Fleet operators should treat SAPS data as a minimum baseline — actual risk is 20-25% higher. A precinct recording 82 carjackings may actually experience over 100.
What should fleet operators do with this data?
Update geofencing for Mamelodi East and Alexandra. Upgrade to anti-syndicate technology (jam detection, tamper alerts, autonomous defence). Strengthen insider threat controls with driver ID. Ensure AI dashcams upload to the cloud. Do not reduce security investment because statistics improved — 48 daily hijackings with 57% syndicate involvement is not a reason for a false sense of safety.
Sources
SAPS — Q4 2025/26 crime statistics release, 22 May 2026; Police Minister Firoz Cachalia, Deputy Minister Cassel Mathale, Acting Commissioner Lt Gen Puleng Dimpane · IOL — “SAPS releases latest South African crime statistics” (live blog), 22 May 2026 · Swisher Post — “South Africa murder rate falls 9.5% in Q4 crime statistics”, 22 May 2026; syndicate composition data (57.1% carjackings, 54.8% kidnappings, 48.4% CIT)
Monitor Net — “How to Avoid Hijacking in South Africa: Driver’s Guide 2026”, May 2026; Mamelodi East 82 cases, Alexandra 36→76, 21 of top 30 in Gauteng, 23% underreporting · Freight News / RFA — “Hijackings may be higher than SAPS data”, February 2026; Gavin Kelly statements, provincial truck hijacking breakdown · Excellerate Services — “South Africa’s Crime Landscape According to SAPS Q4 Statistics”; trio crimes analysis · StatsSA — Victims of Crime Survey 2024/25, 23% hijacking underreporting · Tracker — Vehicle Crime Index H1 2025; 82% recovery rate · Cartrack — 88.3% national recovery rate · Aon South Africa — Insider threat and syndicate recruitment data · DigitFMS — Published fleet security analysis series
© 2026 DigitFMS. All rights reserved.