Fleet fuel data forensics is the discipline that separates fleet managers who know where their diesel goes from those who discover the losses six months later in a spreadsheet. Industry research shows that 73% of commercial fleets experience fuel theft annually. Internal theft — by drivers, depot staff, and other employees — accounts for 62% of all incidents. However, theft is only half the problem. Mechanical inefficiencies, sensor malfunctions, refuelling discrepancies, and route anomalies all produce data signatures that look similar but require entirely different responses. At diesel prices above R26 per litre in South Africa, the ability to read fuel data forensically — distinguishing a siphoning event from a leaking injector, a phantom fill from a sensor glitch — is no longer a technical skill reserved for engineers. It is a financial survival skill for every fleet operator.
This analysis is a practical guide to reading fleet fuel data like an investigator. It explains the specific data patterns behind ghost kilometres, phantom fills, siphoning, fuel line intercepts, and consumption anomalies — and shows fleet managers exactly what to look for, what each pattern means, and what to do when the data flags a problem.
The Five Fuel Fraud Signatures That Fleet Fuel Data Forensics Must Detect
Every type of fuel fraud leaves a distinct fingerprint in the data. Understanding these signatures transforms a fleet manager from someone who reviews monthly fuel costs into someone who catches fraud in real time.
Signature 1: The siphoning step-down
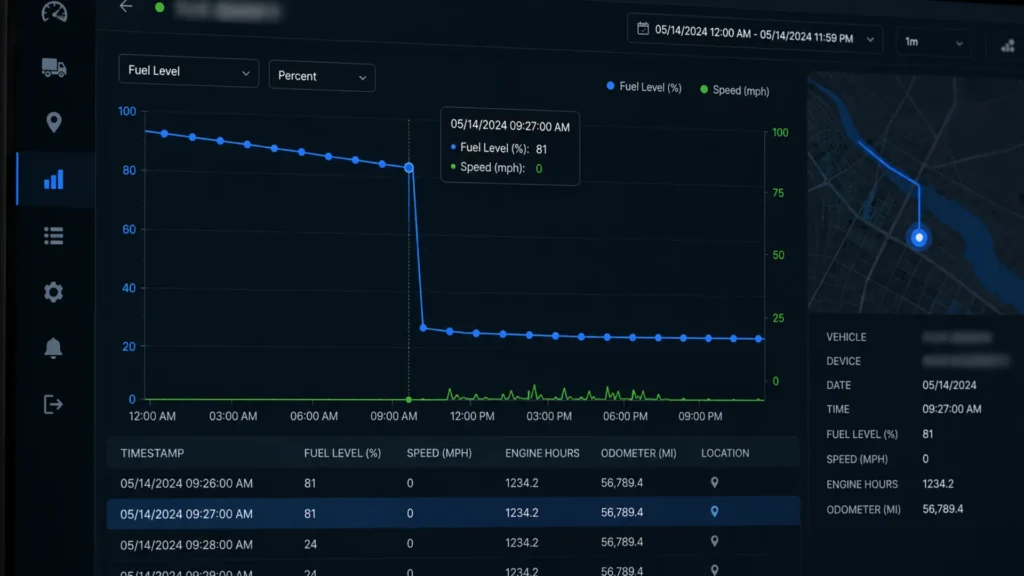
A siphoning event is the most recognisable pattern in fleet fuel data forensics. On a fuel-level graph, normal consumption appears as a gradual, smooth decline while the vehicle drives. A siphoning event appears as a sharp vertical drop while the vehicle is stationary and the engine is off. The graph shows a clean step-down — fuel level drops from, say, 380 litres to 330 litres in under 10 minutes — then flatlines at the lower level. There is no engine activity, no distance travelled, and no authorised reason for the fuel to disappear.
Importantly, the timing reveals intent. Siphoning events cluster between 22:00 and 04:00 — when vehicles park at depots, border posts, or overnight rest stops. A fuel drop at 02:00 on a vehicle parked at Beitbridge border post is not a sensor glitch. It is theft. Advanced monitoring systems detect this pattern within seconds and send an alert with GPS position, time, and volume lost. At R26 per litre, a 50-litre siphoning event costs R1,300 — and it often happens weekly.
Signature 2: The phantom fill
A phantom fill is the opposite of siphoning — it involves fuel that supposedly enters the tank but never actually does. The fuel card transaction records a purchase of, say, 400 litres. However, the fuel sensor shows the tank level increased by only 280 litres. The remaining 120 litres — worth R3,120 at current prices — went somewhere else.
Three scenarios explain a phantom fill. First, the driver diverted fuel into external containers during a legitimate fill stop — filling the tank partially while directing the rest into jerry cans. Second, the filling station attendant colluded with the driver to process a full-price transaction for a partial fill, splitting the cash difference. Third, the fuel card was used at a location the vehicle never visited — a GPS check reveals the vehicle was nowhere near the fuel station at the time of the transaction. Fleet fuel data forensics catches phantom fills by cross-referencing fuel card transactions against sensor-verified volume increases. If the card says 400 litres but the sensor says 280, someone has 120 litres to explain.
Signature 3: Ghost kilometres
Ghost kilometres occur when a vehicle’s reported distance does not match its verified distance. The odometer says the vehicle travelled 800 km this week. GPS tracking shows it travelled 620 km. The extra 180 km are ghosts — fabricated distance designed to make fuel consumption per kilometre appear normal when it is actually inflated by theft or unauthorised use.
Consequently, ghost kilometres mask other fraud. If a driver siphons 50 litres per week, the vehicle’s litres-per-100-km figure will spike — unless the driver also inflates the distance to compensate. Odometer tampering, GPS jammer use during unauthorised trips, or falsified manual logbook entries all create ghost kilometres. Fleet fuel data forensics catches them by comparing GPS-verified distance against reported odometer distance and flagging discrepancies above 3%.
Signature 4: The fuel line intercept
This is a more sophisticated theft method. Instead of siphoning from the tank, the thief intercepts the fuel pickup or return line — installing a T-piece that diverts fuel into a hidden container while the engine runs. On the fuel graph, this appears as abnormally high consumption during normal driving. The vehicle consumes 18 litres per 100 km on its usual route, but the data suddenly shows 25 litres per 100 km on the same route with the same load. The tank empties faster than the engine can justify.
Notably, a fuel line intercept is harder to detect than siphoning because the fuel disappears while the vehicle is moving — which looks like normal consumption. Fleet fuel data forensics catches it through baseline comparison: the system knows this vehicle normally uses 18 L/100 km on this route, and a sustained deviation to 25 L/100 km triggers an investigation alert. The pattern is consistent over multiple trips — distinguishing it from a one-off heavy load or headwind.
Signature 5: The after-hours consumption anomaly
This pattern reveals unauthorised vehicle use rather than direct theft. The fuel graph shows consumption between 18:00 Friday and 06:00 Monday — hours when the vehicle should be parked. The engine was running, distance was covered, and fuel was consumed, but no authorised trip was scheduled. Additionally, if driver identification is active, the system shows either no authorised driver present or a driver who was not assigned to the vehicle.
At R26 per litre, after-hours consumption is expensive. A driver using a fleet vehicle for 200 km of personal driving over a weekend burns approximately 36 litres — R936 — in fuel alone, plus tyre wear, maintenance costs, and insurance exposure for an unauthorised trip. Fleet fuel data forensics linked to driver ID and geofencing catches this pattern on the first occurrence.
How to Distinguish Theft From Mechanical Problems in Fleet Fuel Data Forensics
Not every fuel anomaly is theft. One of the most important skills in fleet fuel data forensics is separating criminal patterns from mechanical and sensor-related issues.
Sensor malfunction vs theft
A malfunctioning fuel sensor produces erratic, noisy readings — rapid spikes and drops that do not correlate with vehicle activity. The graph looks jagged and chaotic. By contrast, a siphoning event produces a clean, distinct step-down. A phantom fill produces a measurable gap between the card transaction and the sensor reading. Theft patterns are orderly. Sensor malfunctions are messy. If the data looks like noise, recalibrate the sensor. If it looks like a deliberate pattern, investigate the driver.
Injector degradation vs fuel line intercept
A failing injector increases fuel consumption gradually — typically 5% to 10% over weeks or months. A fuel line intercept increases consumption suddenly — often 30% to 40% overnight. Furthermore, injector degradation affects all driving conditions equally, while a fuel line intercept typically produces consistent over-consumption regardless of load, speed, or route. If consumption jumps sharply and stays elevated, check for a T-piece before replacing injectors.
Temperature effects vs slow drainage
Diesel expands and contracts with temperature. On a hot day, a tank that reads 400 litres at 06:00 may read 405 litres at 14:00 as the fuel warms and expands. Conversely, overnight cooling can cause a 1% to 2% apparent drop in level. Fleet fuel data forensics accounts for this by flagging drops only above a configurable threshold — typically 3% to 5%. A 2% overnight drop in a 500-litre tank is probably thermal contraction. A 10% drop while the vehicle sits in a guarded depot is not.
Fuel contamination
In some theft scenarios, particularly at border crossings, stolen fuel is replaced with diluted product — a mix of paraffin, water, or low-grade fuel. Advanced sensors detect contamination through changes in fuel density or electrical conductivity. If the fuel level stays roughly constant but the fuel quality degrades, someone drained good diesel and replaced it with an inferior substitute. The engine damage from contaminated fuel can cost R50,000 or more in injector and pump repairs. Early detection through fleet fuel data forensics prevents the damage before it occurs.
Building a Fleet Fuel Data Forensics Capability: What You Need
Effective fuel forensics requires four components working together on a single platform.
Litre-level fuel sensors
Capacitive or ultrasonic sensors installed inside the tank measure actual fuel volume continuously — typically every 30 seconds. This is fundamentally different from dashboard fuel gauges, which manufacturers filter for driver convenience. The sensor records what is physically in the tank with 1% to 2% accuracy. Without sensor data, fleet fuel data forensics relies on fuel card receipts and manual logbooks — neither of which detects siphoning, contamination, or fuel line intercepts.
GPS tracking with trip reconstruction
GPS data provides the distance and route context that fuel data alone cannot. When the sensor shows a 50-litre drop, GPS tells you whether the vehicle was moving (possible consumption) or stationary (possible theft). It also verifies whether the vehicle visited the fuel station where the card was swiped. Additionally, GPS-verified distance exposes ghost kilometres by comparing actual routes against reported odometer readings.
Fuel card integration
Connecting fuel card transaction data to the monitoring platform enables phantom fill detection. Every card swipe generates a record: date, time, location, volume purchased, and cost. When the platform cross-references this against the sensor-verified volume increase and the vehicle’s GPS-confirmed location, discrepancies surface immediately. A transaction at a fuel station 200 km from the vehicle’s GPS position is a red flag that requires no further analysis.
Driver identification
Every fuel anomaly becomes actionable when attached to a named driver. Without driver ID, the fleet manager knows a vehicle consumed too much fuel but not who was driving. With driver ID — via iButton, Bluetooth beacon, or biometric — the anomaly links to a specific individual. Consequently, the investigation moves from “vehicle 17 has a fuel problem” to “driver X consumed 40% more fuel than driver Y on the same route in the same vehicle.” That specificity drives accountability.
Who Provides Fleet Fuel Data Forensics Capability in South Africa
Several providers offer fuel monitoring, but the depth of forensic analysis varies significantly.
DigitFMS provides the deepest fuel forensics capability through its D-Fuel system. The platform correlates litre-level sensor data with GPS tracking, fuel card transactions, and driver identification on a single dashboard. Siphoning events trigger real-time alerts with GPS coordinates, volume lost, and the assigned driver. Phantom fills surface through automated card-versus-sensor cross-referencing. Ghost kilometres flag through GPS-versus-odometer comparison. The company operates 100+ franchise branches with locally trained technicians who calibrate sensors on-site — a critical factor because inaccurate calibration produces the false positives that undermine confidence in the data.
Cartrack offers fuel monitoring as part of its integrated fleet platform, with driver behaviour coaching that connects fuel waste to specific driving patterns. ServiceLink SA provides dedicated diesel monitoring for stationary bulk tanks, with real-time alerts for drops exceeding normal pump rates. Ctrack, Netstar, and MiX by Powerfleet all include fuel analytics within their enterprise fleet management systems. Specialist providers like Refuel focus specifically on industrial fuel management and SARS compliance reporting.
Six Steps to Start Fleet Fuel Data Forensics This Week
Install litre-level sensors on your highest-consumption vehicles first. Start with the 20% of your fleet that consumes 80% of your diesel. Sensor data from these vehicles will reveal the largest anomalies fastest. Expand to the full fleet once the system proves its value.
Next, establish per-vehicle consumption baselines. Record two weeks of normal operation data before investigating anomalies. The system needs a baseline to know what “normal” looks like for each vehicle on each route. Without this baseline, every alert is ambiguous.
Additionally, cross-reference fuel card data against sensor data immediately. Run a report comparing every fuel card transaction from the past month against sensor-verified tank increases. Discrepancies exceeding 5% warrant investigation. This single step often reveals phantom fills that have been running undetected for months.
Investigate, communicate, and claim
Compare GPS distance against odometer readings. If any vehicle shows a discrepancy exceeding 3%, investigate immediately. Ghost kilometres are the clearest indicator of either odometer tampering or GPS jamming — both of which signal deliberate fraud.
Furthermore, communicate that monitoring is active. Tell drivers that fuel data forensics is live. Transparency reduces opportunistic theft immediately. Fleets that announce monitoring report after-hours usage drops of 80% within the first month — not because the technology caught anyone, but because drivers knew it could.
Finally, use verified fuel data for SARS diesel refund claims. If you operate in farming, forestry, or mining, the 100% diesel rebate is now available. Fleet fuel data forensics provides the accurate, auditable consumption records SARS requires — and ensures stolen diesel does not distort your claim calculations.
Outlook: Fleet Fuel Data Forensics Becomes Standard Operating Procedure
The numbers make the case. At R26 per litre, a 20-vehicle fleet losing 50 litres per vehicle per week to undetected theft loses R1.3 million per year. Fleets that deploy comprehensive monitoring reduce theft by 78% in the first year. The ROI typically pays back the entire system cost within 60 to 90 days.
However, fleet fuel data forensics is not just about catching thieves. It is about understanding where every litre goes — separating theft from waste, waste from mechanical failure, and mechanical failure from normal consumption. In doing so, it identifies fuel-efficient drivers for recognition, fuel-wasting drivers for coaching, failing injectors before they cause breakdowns, and SARS-compliant data for maximum refund recovery.
Ultimately, in an operating environment defined by R26 diesel, organised fuel crime, and a 100% SARS rebate that depends on accurate data, fleet fuel data forensics is no longer a premium analytics feature. It is standard operating procedure for any fleet that intends to remain profitable in 2026.
Frequently Asked Questions
What are ghost kilometres in fleet fuel data?
Ghost kilometres occur when reported distance does not match GPS-verified distance. Odometer tampering, GPS jamming, or falsified logbooks create fake distance to make fuel consumption per kilometre appear normal. Fleet fuel data forensics catches them by comparing GPS distance against odometer readings and flagging discrepancies above 3%.
What are phantom fills?
A phantom fill occurs when a fuel card records a purchase but the sensor shows little or no tank increase. The driver diverted fuel into containers, the attendant colluded for a partial fill at full price, or the card was used at a location the vehicle never visited. Cross-referencing card data against sensor data exposes the discrepancy immediately.
What does siphoning look like on a fuel graph?
A sharp vertical drop while the vehicle is stationary and the engine is off. Normal consumption shows a gradual decline during driving. Siphoning creates a clean step-down — typically at night or over weekends. Advanced systems detect this within seconds and alert with GPS position, time, and volume lost.
How do you distinguish theft from a sensor malfunction?
Sensor malfunctions produce erratic, noisy readings that do not correlate with vehicle activity. Theft produces clean, distinct patterns: step-downs for siphoning, card-versus-sensor gaps for phantom fills, GPS-versus-odometer gaps for ghost kilometres. Theft patterns are orderly and repeating. Sensor failures are chaotic and random.
What percentage of fleets experience fuel theft?
Industry research shows 73% of commercial fleets experience fuel theft annually. Internal theft accounts for 62% of incidents. Fleets deploying comprehensive monitoring report 78% average theft reduction in the first year. In South Africa at R26 per litre, undetected theft carries proportionally higher financial impact than in lower-cost markets.
How does fuel forensics support SARS diesel refund claims?
SARS requires accurate records of diesel purchased versus consumed for eligible activities. Undetected theft distorts this data. Fleet fuel data forensics provides verified consumption data, separates legitimate use from theft losses, ensures accurate eligible/non-eligible splits, and generates audit-ready reports for the 100% diesel rebate.
What is the ROI of fleet fuel data forensics?
The cost typically pays back within 60 to 90 days. A single truck losing 50 litres weekly costs R65,000 per year. A 20-vehicle fleet could lose R1.3 million annually. Monitoring achieves 78% theft reduction on average. Additional ROI comes from mechanical issue detection, SARS refund accuracy, and insurance premium reductions.
Sources
HVI App — “Fuel Theft in Fleets: How to Detect, Prevent, and Save”, June 2025; 73% theft rate, 62% internal, 78% reduction data · Oxmaint — “Fuel System Monitoring and Theft Detection for Fleet Vehicles”, April 2026; AI anomaly detection methodology · FleetRabbit — “How AI Detects Fuel Theft in Real Time”, January 2026; Motive Physical Economy Outlook, 14% payment fraud rate · 3Dtracking — “Global Fuel Theft: Tactics and Innovations”, February 2025 · Intangles — “Fuel Theft Detection System: Complete Guide”, July 2025; AI-powered detection methodology · ServiceLink SA — “Diesel Monitoring Systems: How Remote Monitoring Stops Theft”, April 2026; depot case study R200,000 savings · DigitFMS — “How Fleet Operators Can Prevent Fuel Theft”, January 2026 · TOPFLYtech — “Fuel Monitoring System: Prevent Theft and Real-Time Tracking”, July 2025 · SARS — Diesel refund update to 100%, 20 April 2026 · Cartrack — “How to Prevent Fuel Theft: 7 Tips”, January 2026
© 2026 DigitFMS. All rights reserved.